The thing I’ve been thinking about most recently in regards to my projects for ITP is how to bring in storytelling. That is my first love and the reason I came to ITP. I want to marry storytelling and filmmaking with technology and explore the world of interactivity. A woman I met through an ITP event, a grad herself, had lunch with me which turned into over two hours of discussing story structure and how it works bringing in the interactive elements. She had a similar background to me and now works building interactive stories for an advertising agency. They have done some pretty great work.
She gave me a list of video games to play that are not as “video game” like as what we usually think of as gaming. Here list included: A Dark Room, Year Walk, Gone Home, the Walking Dead Game and Her Story.
I haven’t had a chance to play them all yet, but it has really gotten me thinking about different ways to incorporate narrative into the new mediums. I do not want to simply force the traditional rules onto different formats, but I also do not believe in throwing away thousands of years of story structure. The new mediums would be best served by building on the past while adapting to their strengths and weaknesses as we discover them.
BUT I’m also determined to learn coding, period. I want to use it for story, but I am also determined to truly become good enough to consider myself a coder in my own right – not simply a filmmaker and writer who can dabble in it. That’s why I didn’t at first want to shy away from traditional data visualization. I went to Moon’s workshop where we spent quite a few hours playing with the weather API. I learned a lot, but after that session, I couldn’t see myself spending more hours on a weather visualization.
I moved onto The Guardian API and The New York Times. The latter was the first one I played with and I did get it to work, but I was more interested in the former. British journalism – particularly book and movie reviews- tops my list of some of the most engaging writing out there. Unfortunately no matter what I did, I could not get the API key for The Guardian to work. I followed all of their instructions, but it kept coming back that the key was invalid.
In the back of my mind, I have been playing with different interactive stories for kids and/or adults. One thing that came to mind while brainstorming my p-comp midterm project was an interactive treasure map – I think it was a throw back to things I loved as a kid. I used to make pirate maps by soaking paper in coffee to “age” it, drawing “Ye old…” pirate’s clues and burning the corners for good measure. In my kid fantasy, you would have to follow the narrative clues left by a pirate and see if you can find his buried treasure. The physical board would resembled a tech version of the old pirate maps I used to make and the screen would have maps/dives etc. I am not sure this is something I will pursue, but it made the Bermuda Triangle pop into my head for this week’s project. I started with searching The New York Times API again, but it turned up more headlines about all things Bermuda than names, dates and disappearances in “The Devil’s Triangle” so I decided to do my own research and built a csv file instead of pulling from an API.
I found a fun website based around Bermuda that had a section on the list of “incidents”, http://www.bermuda-attractions.com/bermuda2_000051.htm. My content for the table came from the site. I simply loaded the dates and stories into an Excel file and saved it as a csv. Then I found this brilliant image to use as the background. As much as I enjoy much of the imagery drawn in p5.js, I wanted something that would not be easy to create in that medium.
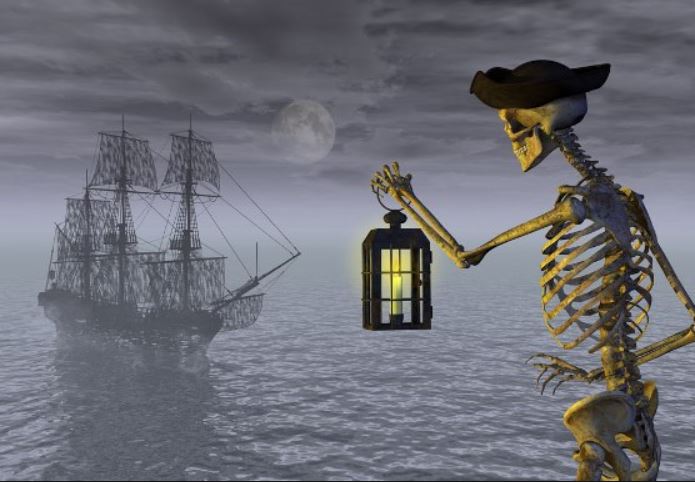
This image was much more the feeling I was looking for and time, as always, was scarce so it became my background mood plate. And I moved onto the timeline and the effects. I wanted to show the years and have the stories appear on the screen when you roll over them. The problem was the text wasn’t particularly readable over the image so I needed to white out the image a bit when the text appears. After trying tint functions that didn’t really work, I decided that simply drawing a rectangle with a partial opacity connected to the roll over function would be more effective. And I noticed as I found the right opacity that as I do it, the effect could mimic lightning which is perfect for the Bermuda Triangle.
Here’s the code:
var table;
var bgimg;
var incidents;
var date;
var canvas;
function preload() {
table = loadTable(“assets/BermudaTable.csv”, “csv”, “header”);
bgimg = loadImage(“assets/Background.png”);
}
function setup() {
canvas = createCanvas(695, 482);
//print(table.getColumn(“Date”));
//print(table.getColumn(“Story”));
date = table.getColumn(“Date”);
story = table.getColumn(“Story”);
}
function draw() {
image(bgimg, 0, 0);
stroke(176, 23, 31);
strokeWeight(5);
line(20, 10, 20, 450);
fill(176, 23, 31);
strokeWeight(1);
for (var i = 0; i < date.length; i++) {
text(date[i], 30, i * height / (date.length + 2) + 20);
if (mouseY > i * height / (date.length + 2) + 12 && mouseY < i * height / (date.length + 2) + 22 && mouseX > 20 && mouseX < 65) {
fill(255, 127);
rect(0, 0, 695, 482);
fill(176, 23, 31);
text(story[i], 60, i * height / (story.length + 2) + 9, width – 60, height – 60);
}
}
}
And here’s the final image before you begin to interact with the dates.
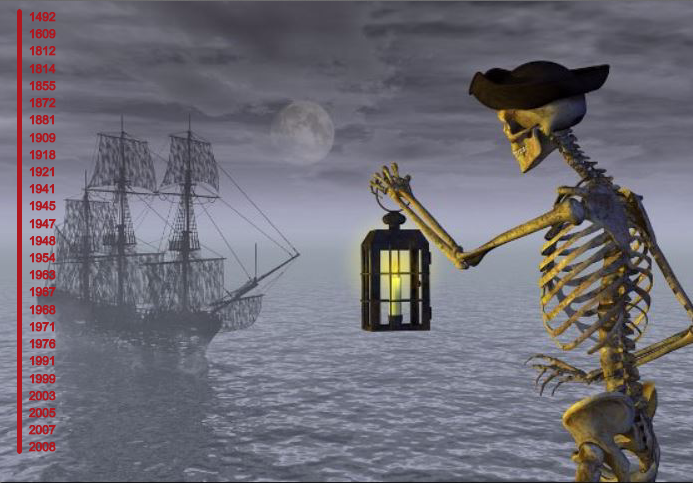
To read all of the ghostly incidents, please click below and interact with the timeline.
https://jamieruddyitp.com/projects/ICM/Bermuda%20Triangle